Run pivot reports
The Run Reports page is where you actually run the reports that you configure on the Define Pivot Reports page.
Pivot reports allow you to perform your own analysis from the bundle adjusted level to the consolidation data. You can drag and drop fields from the filter area to the row, the column, and the data area. Like in an Excel pivot table, you can select any dimension from the list in the filter section of the page, and put it in row or column and apply filters to that dimension. By adding dimensions, you can see the underlying elements that have impacted the final result displayed in some reports. The figures in the report are refreshed each time the data is updated in Financial Consolidation.
You can save your pivot report in order to reuse it; and export it in an Excel format.
To access the Run Reports page, click  Reports > Pivot Reports > Run Pivot Reports.
You can also access the Run Reports page when you click  or
or  on the Define Pivots Reports page.

-
Choose your report - drop-down list from which you can choose the report you defined on the Define Pivot Reports page.
-
Show selection - when selected, displays the left-side panel consisting of the Filter, Rows, Columns, Data and All filters. This is the default layout.
-
Hide selection - when selected, hides the left-side panel.
-
Show headers on Rows/Columns - show or hide the row /column fields at the left or on top of the data area. Showing them allows you to use filtering and sorting.
-
Refresh: Refreshes the data on the page.
Run a pivot report
-
Choose a report from the Choose your report field. Reports configured on the Define Pivots Reports page are listed in the drop-down.
Tip: If you find the report on which you want to base your new report, choose it and then, click
 . Enter a unique Code and Description for the report and proceed to the next step.
 -
From the All panel, drag fields to the Row panel, Column panel, or Data panel to split the figures.
-
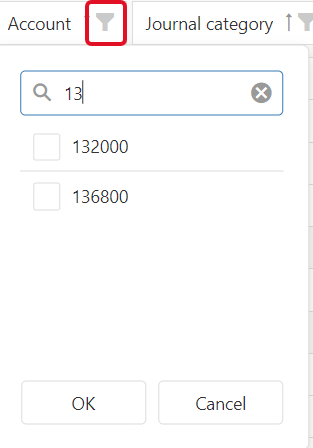
For each of the dimensions you selected, you can click
 to display a drop-drop list that includes a Search function and selection options. Use the Search function to limit the data displayed.
 For example to see account numbers beginning with 13, enter 13 in the Search field and press enter:
-
You have these options to view the selected dimensions:
-
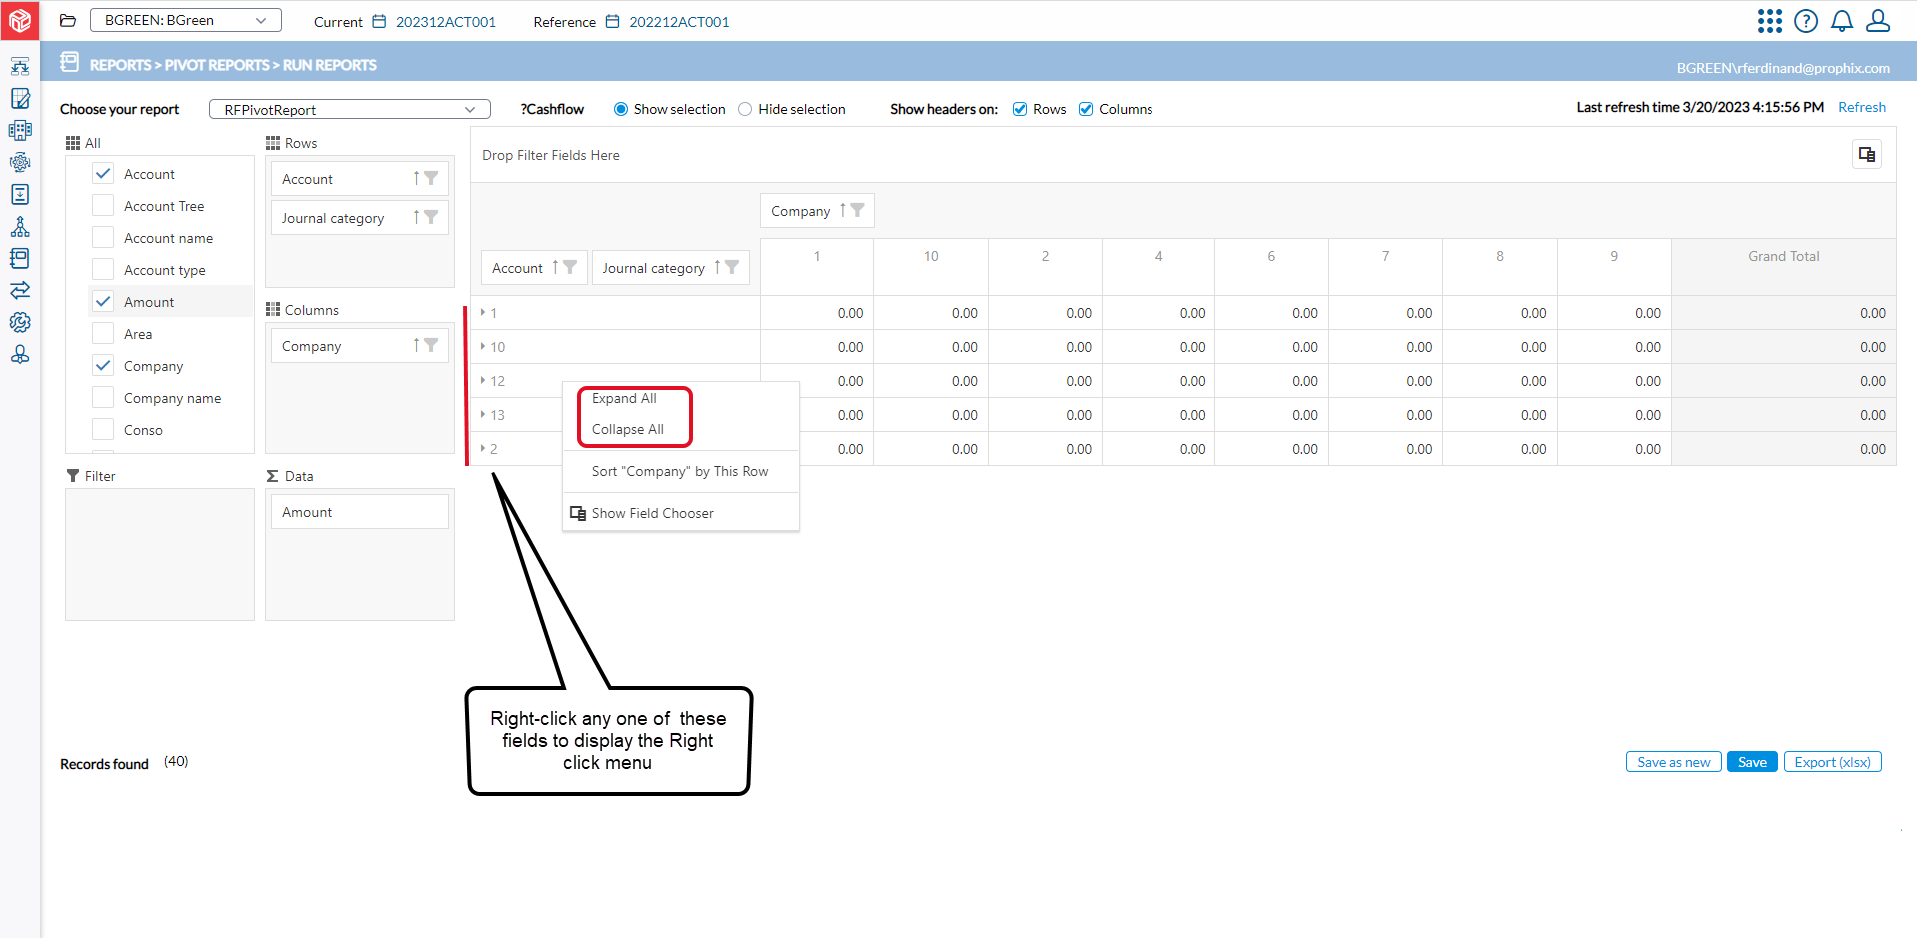
To see the dimension in a single field, click the arrow beside it to expand it.
-
To see the selected dimension in all the fields, right-click on any of the fields and then, select Expand All from the menu. To collapse the rows, right-click again and select Collapse All.
-
-
When you have finished defining the content, click
 . Saving your report allows you to re-use it. You can also click and save it with a different name.
 -
Click
 .The report is generated and downloaded to your machine.